A Ruby on Rails application can gradually lose its responsiveness as traffic increases and new features are introduced. Pages take longer to load, background jobs slow down, and peak usage triggers occasional timeouts. These changes often appear minor at first, but over time they raise infrastructure costs, impact user experience, and create hidden operational risks.
Ruby on Rails is built to scale when engineered and maintained correctly. Most performance issues stem from architectural decisions, inefficient database queries, or lack of consistent monitoring. From optimising production Rails applications across SaaS and enterprise systems, we have seen that sustainable performance depends on continuous evaluation rather than one time fixes.
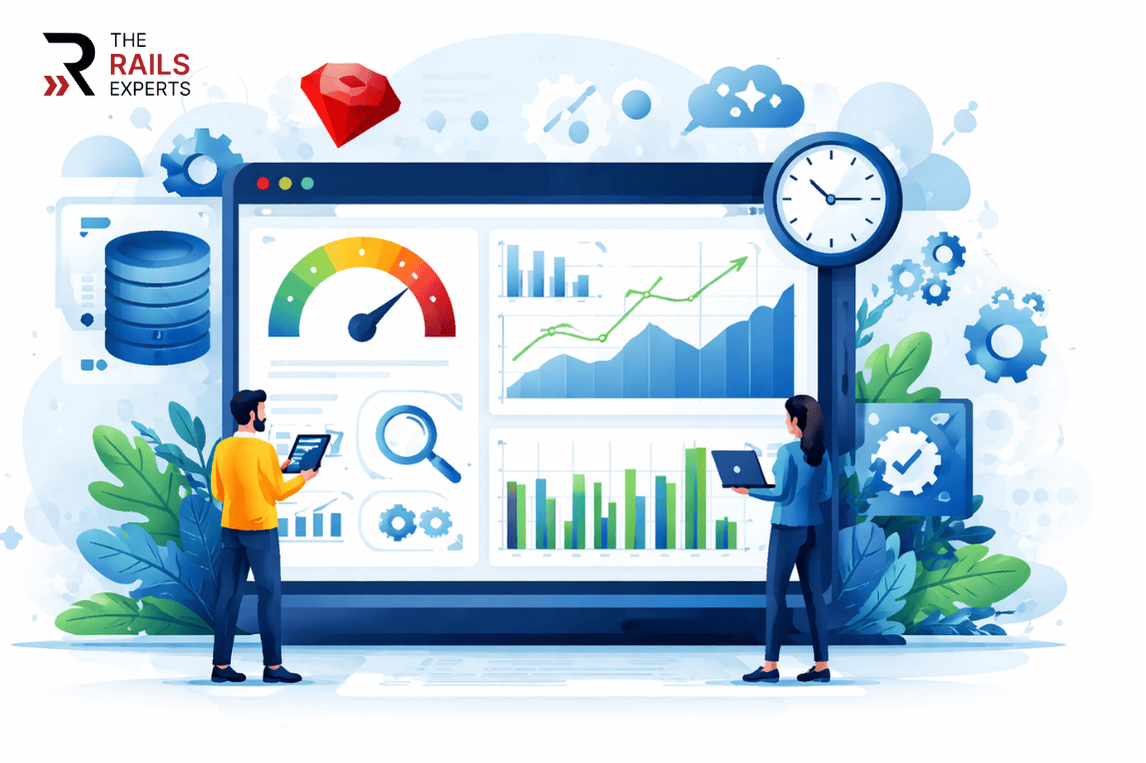
In this article, you will learn how to assess your Rails application’s performance health, uncover hidden bottlenecks, and take practical steps to maintain scalability and long term stability.
Why does Ruby on Rails application performance matter?
Performance influences far more than speed.
When your Rails application responds quickly, users complete tasks without friction. In e-commerce platforms, SaaS dashboards, healthcare systems, or financial tools, delays can directly affect revenue and operational efficiency.
Performance also shapes perception. Users associate fast applications with reliability and professionalism. Even small delays can create doubt about quality and security.
From a business standpoint, optimized performance reduces infrastructure waste. Efficient applications use CPU, memory, and database resources wisely, helping control hosting expenses while preparing for future growth.
Strong performance is not just technical excellence. It is strategic advantage.
What are the key areas to assess in a Rails application?
Performance evaluation should be structured and data-driven. Below are the primary areas you should examine.
1. Are you monitoring your Ruby on Rails app using performance tools?
You cannot improve what you cannot measure.
Application performance monitoring tools provide visibility into request lifecycles, background jobs, external API calls, and database queries. They show where time is spent and where bottlenecks occur. You can explore tools listed in the official Ruby on Rails performance tuning guide to better understand how profiling and instrumentation work within the Rails ecosystem.
Start by defining acceptable benchmarks:
- Target response times
- Error rate thresholds
- Expected throughput
Once monitoring is active, review slow endpoints, abnormal spikes, and recurring latency patterns. This establishes a performance baseline and reveals improvement opportunities.
Without monitoring, performance decisions become guesswork.
2. Is your database slowing down the application?
Database inefficiencies are one of the most common causes of Rails performance issues.
As data grows, poorly structured queries can significantly increase response time. Common warning signs include:
- Repeated N+1 query patterns
- Full table scans
- Missing indexes
- Slow joins
Review execution plans for frequently executed queries. Optimize indexing strategies and simplify query logic where possible.
Because Ruby on Rails relies heavily on Active Record, monitoring the SQL generated behind the scenes is critical for maintaining efficiency. The official Active Record Query Interface documentation explains how queries are generated and how to structure them more efficiently.
3. How fast are core user journeys?
Response time directly impacts user experience.
Identify business-critical workflows such as:
- User authentication
- Checkout or payment processing
- Dashboard loading
- Data submission
Measure how long these actions take under normal load and during peak usage.
Load testing is equally important. You can also refer to Google’s Core Web Vitals guidelines to better understand user-perceived performance standards and how they influence engagement and retention. Simulating increased traffic helps you understand how many concurrent users your system can support before performance degrades.
This proactive approach prevents surprises in production.
4. How does the application handle large requests and files?
Real-world usage rarely involves uniform request sizes.
Your Rails application may process:
- Large payload submissions
- File uploads
- Bulk API requests
Test small, medium, and large payload scenarios. Monitor CPU, memory, and response time under each condition.
Identifying thresholds early helps prevent timeouts and system instability during high-volume operations.
5. Are CPU and memory usage within safe limits?
High resource utilization can signal inefficiencies or scaling constraints.
Track:
- CPU consumption
- Memory usage
- Background worker load
- Garbage collection frequency
Consistently high usage may indicate inefficient code paths or poorly optimized background processing.
For containerized deployments, use environment monitoring tools to understand scaling behavior and resource allocation patterns.
Keeping utilization stable ensures reliability during peak traffic.
6. Are error rates increasing under load?
Performance degradation often reveals itself through errors.
Monitor:
- 500-level server errors
- Timeouts
- Failed background jobs
- Database connection issues
Correlate error spikes with traffic and resource metrics. Patterns often point directly to bottlenecks.
Maintaining low error rates strengthens trust and protects business continuity.
7. Is your application meeting uptime expectations?
Availability is a core performance indicator.
Most business applications target at least 99.9 percent uptime. Even brief outages can damage reputation and revenue.
Implement uptime monitoring that continuously checks application availability and response health. Rapid alerts allow quick remediation before minor issues escalate.
What metrics define a healthy Rails application?

While benchmarks vary by industry, healthy Rails applications generally maintain:
- Response times under one second for standard requests
- Stable throughput during peak traffic
- Low and predictable error rates
- Uptime above 99.9 percent
- CPU and memory usage below critical thresholds under normal load
- Reliable concurrency handling
Tracking these metrics consistently provides clarity about system stability.
What are the common risks of ignoring performance?
Ignoring performance validation can lead to:
- Gradual user churn due to slow experiences
- Rising infrastructure costs from inefficient scaling
- Production outages during traffic spikes
- Increased technical debt
Addressing performance reactively is far more expensive than maintaining it proactively.
What should you do next to improve your Rails application performance?
If your Rails application has not undergone a structured performance evaluation, start by implementing monitoring and defining clear benchmarks. This helps you detect whether your system is meeting expectations or gradually slowing down.
If issues are already visible, focus on database optimization, response time analysis, and load testing to identify root causes early.
Performance validation should be continuous, not a one-time task. If you need support assessing or improving your application, talk to our team to move forward with clarity and confidence.
A high-performing application ensures reliability, user trust, and sustainable growth.
